
A Physical DCF Calculator And Piotroski F-Score Tool For More Deliberate Stock Research


A stock can look cheap because its business is improving, or because its problems have not yet reached the headline numbers. I built a touchscreen investor tool around that distinction.
On one compact CYD board, you can estimate a DCF stock price target, check nine Piotroski financial signals, and examine how your assumptions change the result. The calculators run on the device with numbers you enter yourself, so the valuation work is available even without Wi-Fi.
Key Takeaways
The CYD calculates DCF fair value from your free cash flow, growth, discount rate, terminal value, net debt, and share count; its result is an estimate under those assumptions.
A five-by-five sensitivity table shows how the target price changes across discount rates and terminal growth rates or exit multiples.
The Piotroski calculator checks nine current-versus-prior-year financial signals and explains each one on demand; its sample 9/9 score is demonstration data, not a stock recommendation.
Both calculators work offline.
Stock investor calculators. DCF price target calculator and Piotroski F-Score calculator
Why Put Stock Analysis On A Physical Device?
Most valuation tools live in a browser. That is convenient, but it can make it easy to skim past the assumptions and focus only on the final target price. A small touchscreen changes the pace of the process: choose a model, enter the figures, review the result, then deliberately change the inputs that matter most.
This version runs on the NM-CYD-C5, an ESP32-based touchscreen board. Its opening menu offers Investor Calculators for hands-on, offline calculations. If you want to see the board and the connected analyzer build, I explain the hardware and the stock analysis setup in my ESP32 AI stock analyzer guide.
The distinction between the two modes matters. DCF and Piotroski use the financial figures you type; neither needs a live stock-data service.
How The Physical DCF Calculator Builds A Stock Price Target
Discounted cash flow, or DCF, asks what a company’s future free cash flow may be worth today. You begin with a sustainable base, forecast future cash flow, discount each year’s amount, and add a value for cash flows after the explicit forecast. For a fuller walkthrough of the model, see my DCF calculator guide.
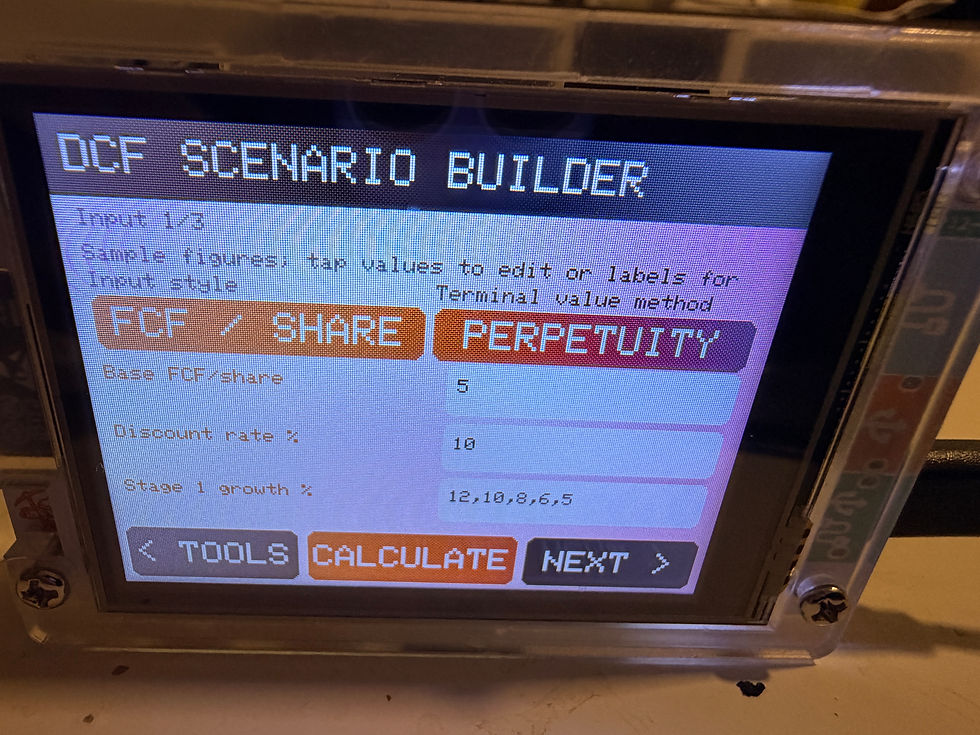
On the device, choose either free cash flow per share or total company free cash flow. Enter the base figure, a comma-separated sequence of Stage 1 annual growth rates, the forecast length, and a discount rate.
You then enter net debt, shares outstanding, and the current stock price. When using company totals, keep free cash flow, net debt, and shares in matching units; for example, millions of dollars and millions of shares.
Next, select one of two terminal value methods. Perpetuity growth assumes cash flow grows at a steady rate after the forecast period. Exit multiple applies your selected multiple to final-year free cash flow. The touchscreen asks for the growth rate or multiple that belongs to the method you selected, without mixing the two assumptions.
The device calculates the forecast cash flow year by year and discounts each year back to today. In perpetuity mode, terminal value equals final-year free cash flow multiplied by one plus terminal growth, divided by the discount rate minus terminal growth. In exit-multiple mode, terminal value equals final-year free cash flow multiplied by the chosen multiple. The device discounts that terminal value to today as well.
The last step connects business value to shareholder value:
Enterprise value = present value of forecast cash flows + present value of terminal value. Equity value = enterprise value − net debt. DCF fair value per share = equity value ÷ shares outstanding. |
The screen then compares fair value with the price you entered. It shows estimated upside or downside and a margin of safety calculated as the gap between fair value and price divided by fair value. The price target is a model output, not a forecast of where the market will trade on a particular date.
An Illustrative DCF Calculation On The Device
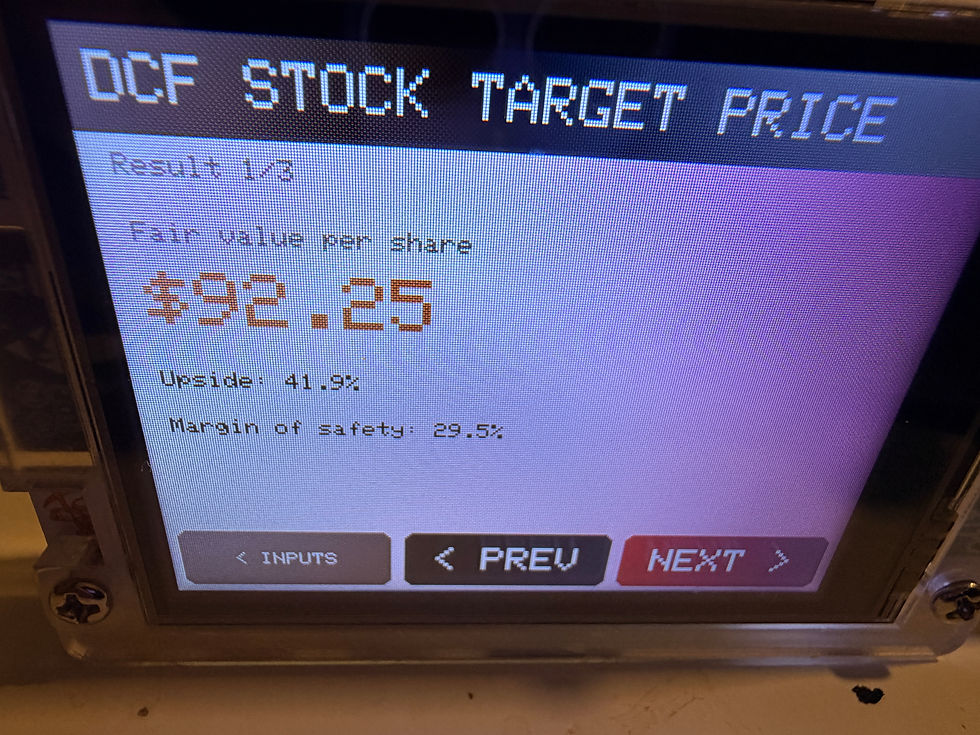
The editable sample starts with $5 of annual free cash flow per share, five growth rates of 12%, 10%, 8%, 6%, and 5%, a 10% discount rate, 3% perpetuity growth, no net debt, 100 shares, and a current price of $65. Under those example assumptions, the device calculates approximately $92.25 of fair value per share. That implies about 41.9% upside relative to the entered price and a 29.5% margin of safety under the device’s formula.
Those numbers describe an imaginary company. Replace every sample figure with data from the business you are researching before drawing conclusions. Starting free cash flow deserves particular care: an unusually strong year can make an otherwise careful DCF look attractive.
What The DCF Sensitivity Table Reveals
A single fair value can hide how much depends on the discount rate or terminal assumption. The device therefore presents a five-by-five table with discount rates down the rows and terminal growth rates or exit multiples across the columns. Its center cell represents the assumptions you entered; nearby cells show how the target moves when you change one or both variables.

In perpetuity mode, each row changes the discount rate by one percentage point and each column changes terminal growth by half a percentage point. In exit-multiple mode, the rows use the same discount-rate steps while columns change the multiple by one turn. If terminal growth reaches or exceeds the discount rate, that scenario is invalid and the device marks it accordingly.
Read the table as a test of your thesis. If a seemingly attractive stock only looks undervalued in the most optimistic corner, the central target needs more scrutiny. If a range of defensible assumptions still gives you room below fair value, you have a clearer basis for further research. |
How The Piotroski F-Score Works On The Touchscreen
The Piotroski F-Score looks at changes in financial condition rather than projecting a future stock price. It awards one point for each of nine passed checks, for a total between zero and nine. My Piotroski F-Score calculator guide explains the framework in more detail.
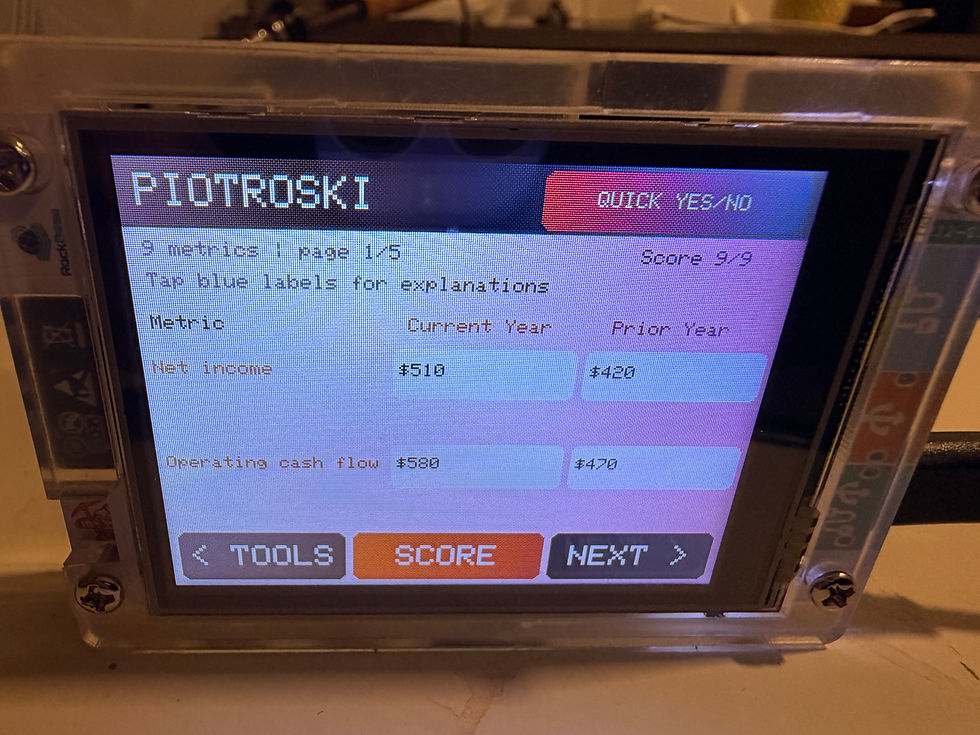
The device asks for current-year and prior-year figures for nine metrics: net income, operating cash flow, total assets, long-term debt, current assets, current liabilities, shares outstanding, revenue, and gross profit. Both columns begin with editable examples. Tap a blue metric label if you want to know what that input means; its explanation opens only when requested and closes with the on-screen X.
From those inputs, the calculator awards one point for each of the following:
Return on assets is positive.
Operating cash flow is positive.
Return on assets improved from the prior year.
Operating cash flow exceeds net income.
Long-term debt divided by total assets declined.
Current assets divided by current liabilities increased.
Shares outstanding stayed flat or fell.
Gross profit divided by revenue increased.
Revenue divided by total assets increased.
The ratios use the total-assets figures entered for each respective year. Enter comparable reporting periods and consistent units so the year-over-year tests mean what you expect. The preloaded figures produce a 9/9 preview to show how the tool works; they do not describe a real stock.
When you press Score, the device shows the total and a breakdown of which tests earned a point.

There is also a Quick Yes/No mode for investors who have already worked out the nine signals and want to use the board as a compact checklist. A 7–9 score is labeled financially strong on the screen, 4–6 is mixed, and 0–3 calls for closer review; the score alone does not establish a buy price.

Why I Use DCF And Piotroski Together
These two calculators answer different questions.
Piotroski asks whether reported financial strength and operating efficiency are improving.
DCF asks what future cash flows might be worth under stated assumptions.
I discuss the full research sequence in Why Piotroski Score Should Be Paired With DCF.
Suppose a company earns eight Piotroski points. That may warrant a closer look, but it does not tell you whether the shares are cheap. Run a DCF using normalized free cash flow, inspect the terminal assumptions and sensitivity grid, and compare the result with the market price. If the valuation appears attractive, check whether the financial statements and business outlook support the growth you entered.
The reverse case is equally useful. A large apparent DCF discount beside a weak Piotroski score is a reason to investigate debt, cash conversion, dilution, and margins before trusting the target. Neither tool removes uncertainty. Together, they make the questions you need to answer more specific.
A More Focused Research Routine
I designed the CYD investor calculator for an investor who wants to work through the numbers rather than receive an unexplained verdict. You can use the offline calculators at a desk with an annual report, test a different growth path in minutes, and immediately see which financial signals passed.
Start with the sample inputs, change one assumption at a time, and then work through a company you know well. The point of a physical calculator is to make your reasoning visible enough to challenge it.
FAQ
Can I Use The DCF And Piotroski Calculators Without Wi-Fi?
Yes. Both calculators run on the CYD board from figures you enter manually.
Does The Device Pull Live Stock Data Into The Offline Calculators?
No. The DCF and Piotroski inputs start with editable demonstration figures. Replace them with current, verified company data; a sample DCF target or 9/9 score is not a result for a real ticker.
What Is The Difference Between Perpetuity Growth And Exit Multiple?
Perpetuity growth extends final-year free cash flow at a steady rate and requires a discount rate above that rate. Exit multiple multiplies final-year free cash flow by a selected figure. The two methods can produce different targets, so check whether each terminal assumption is defensible.
What Does A Piotroski Score Of Nine Mean?
It means all nine accounting checks passed for the current and prior-year numbers entered (strong fundamentals). It does not mean the stock is undervalued or that future returns are assured.
Why Does The DCF Target Change When I Adjust The Discount Rate?
The discount rate determines how much future cash flow is worth today. A higher rate generally reduces present value; a lower one raises it. The sensitivity table makes that relationship visible alongside changes in terminal growth or the exit multiple.
Should I Run The F-Score Or The DCF First?
Either order works. I often start with the F-Score to spot changes in financial quality, then use DCF to test what I might pay. The final decision still requires a close look at the business, the source financial statements, and the assumptions behind the valuation.



Comments